How a UK automotive performance parts brand lifted AOV by 28%
- +274%non-brand organic clicks in Google Search Console (3.74x)
- 3.2xmore first-time buyers from organic search
- +36%estimated monthly organic purchase revenue
- +28%higher average order value from organic search (€388 to €497)
- Client
- A UK manufacturer of aftermarket performance chassis components: sway bars, tie links, roll cages and track-day accessories. Sells to road drivers, track-day enthusiasts and motorsport builds across the UK and EU.
- Timeframe
- June 2024 to September 2026. Markets: UK, Germany, Netherlands and France
- What we did
- Technical SEO and on-site fixes, off-site authority work, vehicle-specific fitment pages, diagnostic articles, product sequencing and upsells with the sales and e-commerce teams, EU demand analysis and localisation into German, Dutch and French
- How we measured it
- Clicks from Google Search Console. Cart value, completed purchases and average order value from GA4, Google organic only. Single-month comparison (June 2024 and September 2026)
Organic search was working for people who already knew the brand
When we started in June 2024, you could find this manufacturer easily if you knew its name or its product names. Searches for the cars and the handling problems its parts solve were a different story.
A Mazda MX-5 ND2 owner looking for a sway bar upgrade. A Golf GTI driver trying to cut body roll. Someone preparing a GR86 for track days and reading up on suspension mods before spending anything. All of them were searching for what the brand sells, and the site wasn’t showing up for them.
We had three jobs:
- Reach drivers who had never heard of the manufacturer
- Help them pick compatible parts and put more of them in one order
- Sell into European markets the business could already supply
The first 3 months were mostly groundwork
For the first two months, organic clicks grew by less than 10% a month. We spent that time on technical SEO, on-site fixes and off-site authority work, with the client’s developers handling implementation and the commercial team steering product and market priorities.
The site had structural limits, and more pages would have just suffered from those limitations. The first vehicle pages went live in August 2024 while that work continued. The strongest growth showed up after about month seven, once the early pages had visibility and the biggest technical blockers were gone.
We built discovery around the vehicle
In the performance aftermarket, most buyers start with a car. Someone shopping for a Golf GTI Mk7 has different fitment needs from a Mk8 owner, and an MX-5 ND1 owner may need different information from an ND2 owner. A broad suspension category page can’t answer those questions well.
Each vehicle page brings together:
- The components the manufacturer supplies for that car
- Fitment and specification details for that generation
- Guidance on the handling problems those parts fix
Every page links straight to compatible products, so a buyer who searches for their car reaches a product in two clicks.
We didn’t build for the whole catalogue at once. We ranked platforms by commercial demand, product availability, higher-value purchase potential and how likely we were to earn real visibility. We started with eight: the Mazda MX-5 ND1 and ND2, Volkswagen Golf GTI Mk7 and Mk8, Toyota GR86, Nissan 370Z, Abarth 500 and 595, and Golf R. Within six weeks, all eight were producing add-to-cart sessions.
Over the next ten months we added 23 more platforms, reaching 31 by June 2025. They included the Seat Leon Cupra and Skoda Octavia vRS, the Honda Civic Type R FK8 and Subaru BRZ, and cars used for track days and competition.
We skipped most of Audi despite the search volume
Our research showed huge search demand around Audi vehicles, and on volume alone it looked like the obvious content opportunity.
We checked it against the client’s commercial and aftermarket modification data and it fell apart. A lot of people searching for a car brand doesn’t tell you how many want performance chassis upgrades, and the client had too little conversion evidence to justify a broad Audi rollout. So we put the money into platforms with stronger signs of modification demand. Specific cars like the Audi TT Mk2 still got dedicated pages.
We wrote for buyers who didn’t yet know which part they needed
Fitment pages work when a driver already knows the modification they want. Plenty of purchases start earlier than that, with a symptom:
- Body roll in fast corners
- Understeer under braking
- Vague steering
- A knock over bumps
A diagnostic article
Written for drivers who know the symptom and haven’t yet worked out which part to buy.
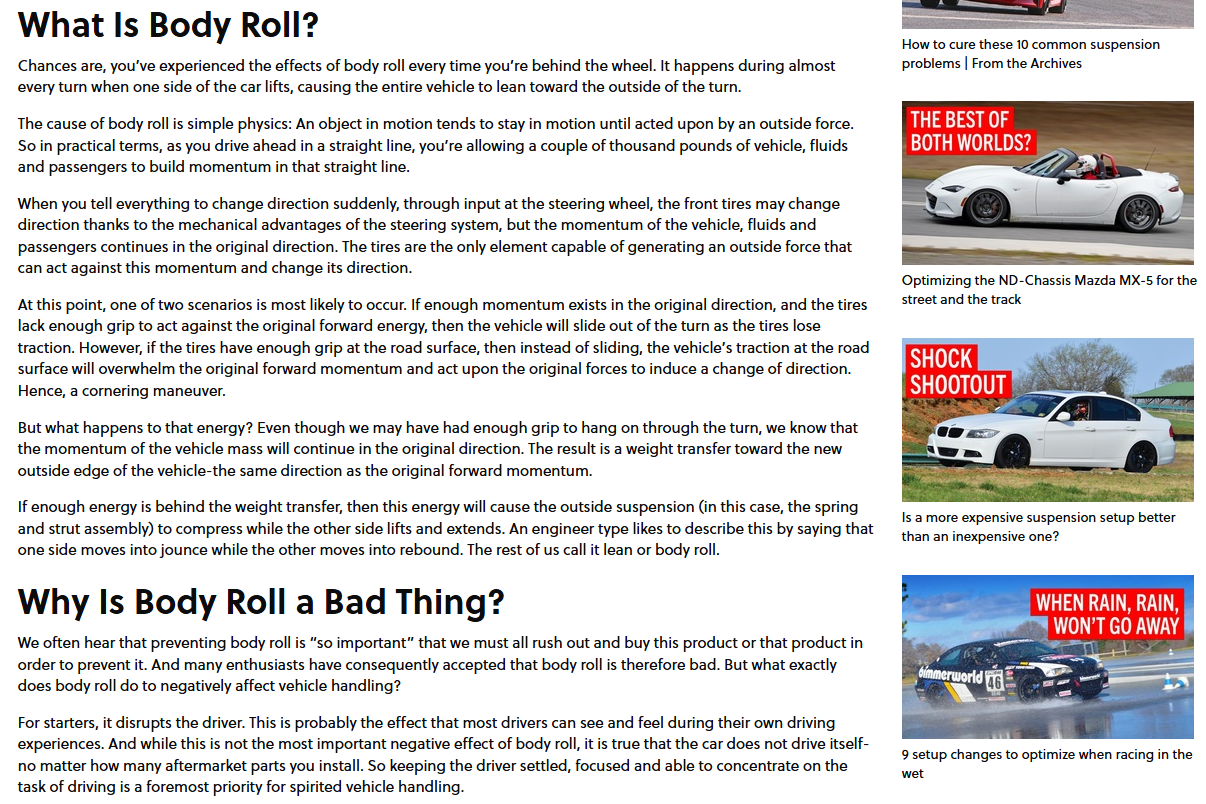
From September 2024 we published diagnostic articles on those problems. Each one explains the likely cause in plain language, lays out the options, and links to the right vehicle page where a product recommendation makes sense. An article on an MX-5 pushing wide through corners, for example, covers how suspension setup and anti-roll bars affect handling balance.
A vehicle fitment page
Each page matches one vehicle platform to the parts that fit it, with a clear route to buy.
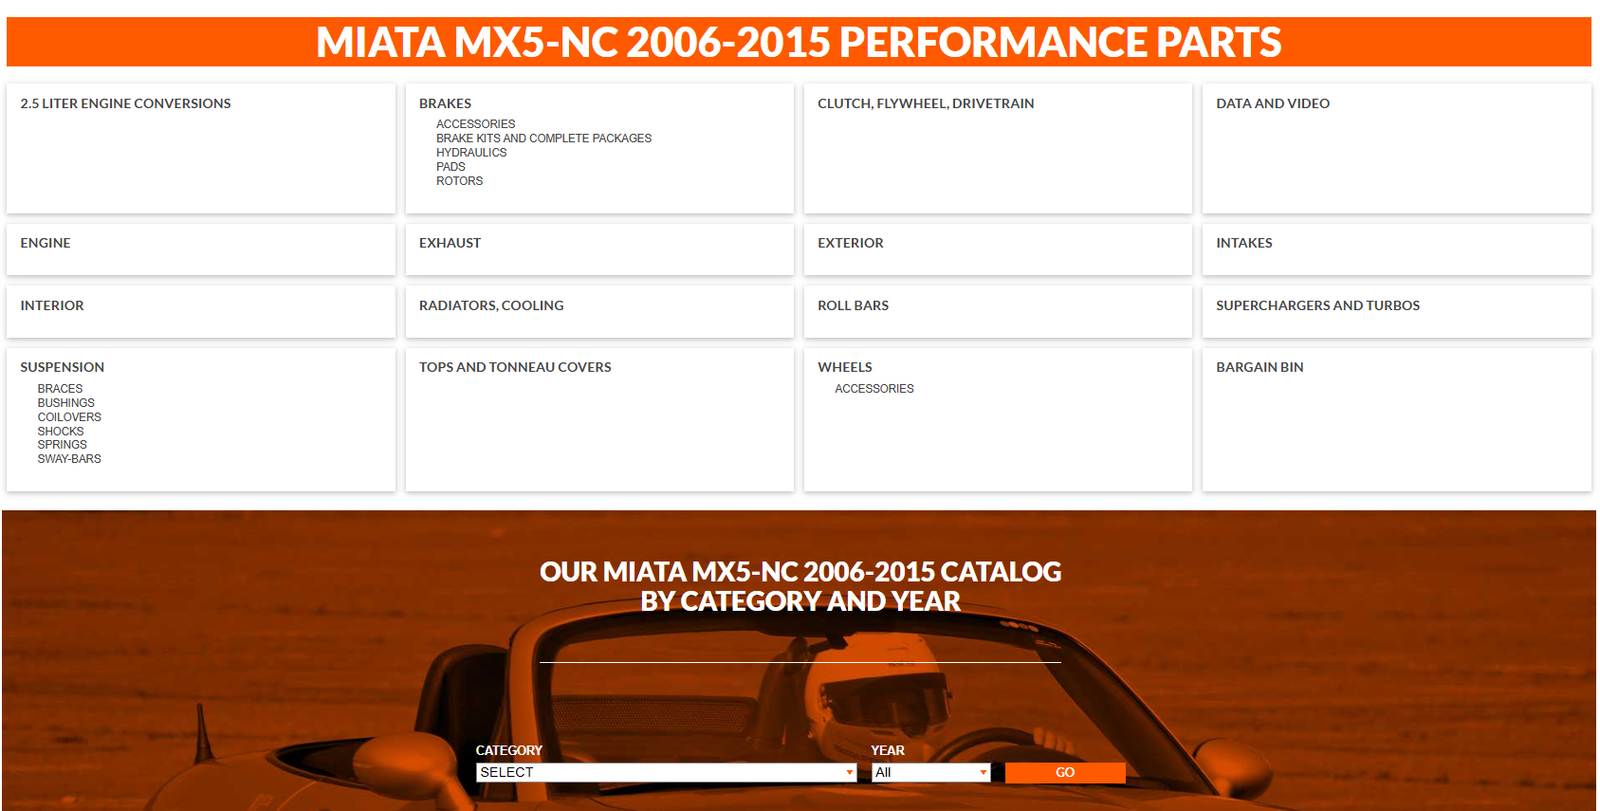
By September 2026, 18 articles were live and seven produced add-to-cart sessions every month. They did most of the work in the first six months, while the fitment pages were still building visibility. The fitment pages overtook them in organic cart value by Q2 2025, and both formats still earn their place.
Golf history content got attention and no sales
The Golf turned 50 in 2024, so we tried content on its history and its generations. It drew readers and helped brand awareness. It didn’t produce meaningful purchase revenue.
In other words, people reading about the history of the Golf weren’t the people about to buy suspension upgrades. We moved the effort to searches tied to modifications, compatible products and buying intent.
We worked with sales and e-commerce to raise what each order was worth
Getting a new buyer onto the site was half the job. The other half was helping them choose the right parts once they were there, and that meant working inside the business.
- With the commercial team, we identified products that gave the biggest handling gains, the best customer satisfaction and the fewest returns or fitment queries. Those became the products featured on vehicle pages and linked from articles.
- With the e-commerce team and the client’s developers, we built upsells around how the work is actually done. Fitting aftermarket suspension arms means taking the suspension apart, which is the best time to replace the bushes. So when someone adds suspension arms, the site offers a discounted bush set.
- The same logic produced other compatible bundles and complete-kit options on vehicle pages and product listings.
From June 2024 to September 2026, average order value from organic search rose from €388 to €497, a 28% increase. Completed organic purchases rose by about 6%. List prices and shipping thresholds moved by no more than 7% over the same period, so most of the rise comes from what buyers chose to put in the basket.
One limit on that claim: our data doesn’t isolate how much of the lift came from bundling and how much from product selection.
The strategy had to fit what the business could supply
In 2026, supply-chain problems hit the manufacturer’s ability to keep stock and scale production. We shifted our priorities toward products the business could actually ship and eased off opportunities tied to unavailable inventory. Sending buyers to something they can’t buy doesn’t help anyone.
We also watched Google’s AI Overviews appear on more of the relevant searches. Where an AI answer cut the chance of earning a click, we weighed that when choosing keywords, and leaned toward commercial searches where normal listings still pulled clicks. We didn’t drop informational content altogether. We just changed how we judged the likely return on each query.
Selling into Europe started with a revenue test
The manufacturer already had logistics and pricing set up for the EU, but its search presence was almost all in English. A buyer searching in German, Dutch or French had no way to find the fitment pages.
Monthly organic cart value by market
Germany, the Netherlands and France, before localisation and in September 2026.
Germany
Netherlands
France
Before we localised anything, we assessed each market on:
- Search demand and local vehicle and component terminology
- Product relevance and existing sales signals
- The cost of localising
Germany and the Netherlands came out on top. German and Dutch pages launched in Q1 2025 and French followed in Q3 2025.
We also set a hurdle: revenue from the localised pages had to reach at least 1.7 times the cost of localisation within three months of launch. That is a revenue-to-cost test, not a profit calculation. All three markets cleared it.
This wasn’t a translation job. We use a process we’ve refined over several years of working in different languages, and every language needs something different. In Germany that meant looking at how buyers describe chassis components, which vehicle generations matter commercially, and where fitment differs from the UK. The German aftermarket has strong interest in domestic makes, older performance cars, restoration and restomod projects, and the client’s growing German sales showed us where to look. A German search for a Stabilisator needs the local term, the right vehicle and the right product on one page, and translating a generic English sway bar page doesn’t give you that.
| Market | Before localisation | Sep 2026 |
|---|---|---|
| Germany | €800 | €14,320 |
| Netherlands | €0 | €9,500 |
| France | €0 | €6,200 |
These are monthly organic cart values, not purchase revenue. Germany’s €800 came from existing pages before localisation started, and the Netherlands reached €7,500 in its first three months. Cart value shows commercial engagement in each market. The 1.7x hurdle was tested on revenue.
Organic search now reaches buyers who had never heard of the brand
- Non-brand organic clicks rose 274%. In Google Search Console that is 3.74x the clicks from searches without the brand name in them.
- First-time buyers from organic search rose 3.2x. Clicks show discovery, and first-time buyers show that new customers came with them.
Those are results over the whole engagement. We can’t say how many of the extra buyers came from any single page type.
| Metric | Jun 2024 | Sep 2026 | Change |
|---|---|---|---|
| Completed organic purchases | 232 | about 246 | +6% |
| Average order value | €388 | €497 | +28% |
| Est. monthly organic purchase revenue | €90,016 | about €122,200 | +36% |
| Monthly organic cart value | €155,000 | €341,000 | +120% |
The revenue figures are calculated from the reported order counts and order values. The September order count is estimated from the 6% increase, so treat them as close approximations, not exact GA4 totals. They also compare two single months, not a monthly gain across the whole engagement, and they aren’t a profit figure. The 27 months included other changes in the business, in demand and in stock.
Cart value grew faster than purchases, and I’d rather say so
Organic growth since June 2024
Completed purchases rose 6%, while average order value rose 28% and monthly organic cart value more than doubled.
Cart value more than doubled while purchase revenue rose 36%. In other words, people are putting a lot more into baskets than they are finishing at checkout.
Here is where September’s organic cart value came from:
| Page type | Sep 2026 |
|---|---|
| English vehicle fitment pages | €19,800 |
| Diagnostic articles | €7,600 |
| German market | €14,320 |
| Dutch market | €9,500 |
| French market | €6,200 |
| New content pages combined | €57,420 (about 17%) |
| Product, category, brand and homepage | €283,580 |
| Total organic cart value | €341,000 |
Closing the gap between cart activity and completed orders is the biggest opportunity left on this account.
Homepage and brand clicks fell, and the buying journey got longer
Organic cart value coming straight from the homepage and brand searches went down over this period. Brand searches themselves didn’t decline. Fewer of them ended in a click to the homepage.
- Google’s AI Overviews spread across industries during this window, and we think they answered more brand searches on the results page.
- Performance parts are a visual product. Buyers want to see them fitted and in use, so more branded demand went to YouTube, Instagram and TikTok, where the brand also publishes.
- The visitors who did arrive through organic search spent more per order.
In other words, a buyer might now search the brand, watch a video, check an Instagram post and then buy. That’s more steps than in 2024, and the new pages made up for the homepage losing share.
What changed beyond the numbers
- Organic search depends less on existing brand awareness. Non-brand clicks grew 274%, and first-time buyers grew 3.2x.
- Vehicle compatibility is now a main route to the site, with 31 platform pages matching searches to parts.
- The manufacturer’s technical knowledge now shows up earlier in the buyer’s research, through 18 diagnostic articles.
- SEO priorities follow commercial evidence. We passed on most of Audi and dropped the Golf history content.
- Stock levels and changes in Google’s results now shape where the effort goes.
- European expansion runs as a measured test with a revenue hurdle, one market at a time.
The commercial director says organic search stopped being only a retention channel
“Before this work, organic search was essentially a retention channel. The fitment pages alone changed that completely. We are now winning customers who had never heard of us, in markets where we were not even visible in the language. The business impact has been just what we needed.”
Dan, Commercial Director
What comes next
- Twelve more vehicle platforms are in the build queue.
- Improving the share of cart activity that turns into completed orders.
- Using growing German demand for older vehicles, restoration and performance mods to guide future content.
Could this work for your brand?
If you rank well for your own name and products, you may still be missing the buyers researching the cars, problems and uses your products serve. Those searches happen every day, in every market you sell into.
On a 30-minute call we’ll look at where your organic search earns money today, where buyers may be finding competitors instead, and which opportunities are worth going after first.